× close
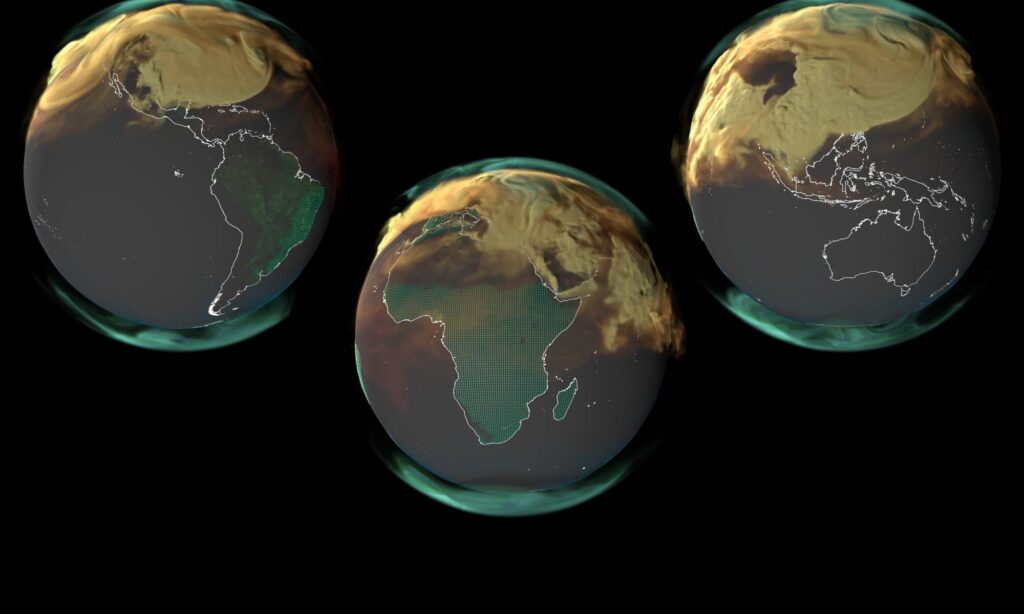
Track carbon emissions and sequestration to determine Earth’s annual global carbon budget. Credit: NASA GEOS
According to the Intergovernmental Panel on Climate Change (IPCC) Sixth Assessment Report (AR6), Human activities have a major impact on the Earth. As global greenhouse gas emissions (mainly carbon dioxide) continue to increase, global temperatures are also rising, with severe impacts on ecosystems. From 2011 to 2020, Earth’s surface temperature rose an estimated 1.07 °C (2.01 °F) above the 1850-1900 average. At this rate, temperatures could rise by an additional 1.5 °C to 2 °C (2.7 °F to 3.6 °F) in the coming decades, depending on whether net zero is achieved by 2050.
Unfortunately, the data for the past year is not encouraging.by Global carbon budget 2023 According to the Global Carbon Cycle (GCB), an annual assessment of the global carbon cycle, emissions continued to increase by 1.1% in 2023 compared to the previous year. This brings total fossil fuel emissions from anthropogenic sources to 36.8 billion tons (over 40 US tons) of carbon dioxide, with an additional 4.1 billion tons (4.5 US tons) from deforestation, extreme wildfires, and other sources. ) has been added. This trend shows that we are moving away from our goals and that things will get worse before they get better.
Carbon budgets are essential for assessing humanity’s impact on the planet and implementing mitigation strategies. This budget quantifies the amount of carbon added to the atmosphere by fossil fuel use, land use change, and other factors, compared to the amount of carbon removed by the Earth’s carbon cycle. This refers to how the Earth and its ecosystems recycle carbon, which keeps carbon dioxide levels in the atmosphere within certain parameters and temperatures stable over time.
For a long time, this balance has been maintained by photosynthetic plants, organisms, and Earth’s oceans, which absorb CO.2 Because of the atmosphere. On the other hand, geological forces (i.e. mantle convection) caused it to become isolated within the Earth’s crust as carbonate rocks. Since the Industrial Revolution, fossil fuel consumption has increased rapidly and worsened sharply since the mid-20th century. Moreover, as the world’s population has increased since the 19th century, land clearing and ecosystem destruction have likewise increased.
In other words, emissions rapidly increased while Earth’s natural sequestration mechanisms were simultaneously destroyed. The Global Carbon Budget was established to analyze these trends and produce reports to inform organizations and guide climate policy development. This year’s report relied on several data sources, the most notable of which were emissions inventories collected by governments and energy agencies. The satellite data were provided by NASA’s Orbiting Carbon Observatory 2 (OCO-2) instrument to estimate carbon fluxes between land and the atmosphere.
C.O.2 Concentrations increased from 278 ppm in 1750 to 420 ppm in 2023. In addition to carbon emissions from transportation, power generation, and manufacturing, key contributing factors this year included Canada’s extreme wildfire season. The data also shows that the Earth’s average surface temperature in 2023 was 1.2 °C (2.1 °F) higher than the average for the NASA reference period (1951-1980), making it the hottest year on record . This is part of a trend that includes: past 10 years (2014-2023) was either the hottest year on record or tied with another year in the same period.
NASA researchers are also creating visualizations that show how carbon dioxide is produced and stored each year, based on climate modeling and data from the Goddard Earth Observing System (GEOS). The visualizations below are based on the latest full-year information available (2021) and include data on vegetation, population density, infrastructure, and wildfires, and show how carbon dioxide is added to and added to the atmosphere. Indicates whether it has been removed. Carbon dioxide emissions are color-coded based on source, showing the two main causes and removal systems.
These include fossil fuel emissions (yellow), biomass burning (red), terrestrial ecosystems (green), and oceans (blue). The Earth’s crust and oceans are both carbon sinks, meaning they remove (and store) more carbon from the atmosphere than they emit. However, as the visualization shows, they can also be a source under certain circumstances, depending on time and location. Remarkably, the proportion of carbon dioxide remaining in the atmosphere (airborne fraction) has remained surprisingly stable over the past 60 years, even as anthropogenic greenhouse gas emissions have continued to rise.

